What are Magnetograms and Tellurigrams?
Magnetogram and Variometer
The purpose of this section is to explain what a magnetogram is and how to obtain it. Understanding the method of magnetic measurement would be helpful for avoiding misuse of magnetograms served from our data center.
Magnetogram
A magnetogram is a graphic representation of magnetic field variation.
Therefore, a plot of geomagnetic data measured with a digital
magnetometer such as a fluxgate magnetometer is also a magnetogram.
However, a 'magnetogram' normally refers to an analog recording obtained
by a torsion-type magnetic variometer
as shown in Figure 1. Until recently,
this type of magnetometer was widely
used and the data were obtained as magnetograms.
Magnetograms have been copied onto
microfilms or microfiches and collected at World Data Centers.
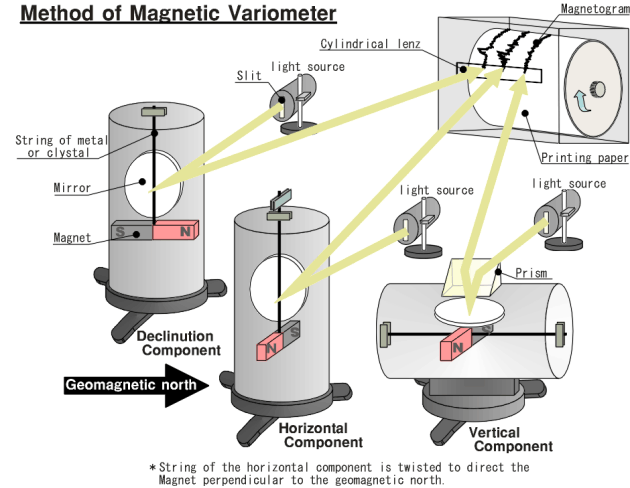
Torsion-Type Magnetic Variometer
Figure 1
explains how geomagnetic variations are measured and recorded by a set
of torsion-type magnetic variometers.
The method is very simple. A small magnet is suspended with a string of
crystal or metal which is used as a spring.
A small rotation of the magnet caused by geomagnetic field variation is
magnified by reflecting a light ray with a small mirror attached
to the magnet. The reflected ray creates a spot on photographic paper
which is placed on a slowly rotating drum.
As seen from the figure, the measurement of declination (D)
is the most straightforward. That is, when the magnet is suspended without torsion, the
magnet points to geomagnetic north at that location.
Therefore, the magnet is most sensitive to force orthogonal
to geomagnetic north, i.e., the variation in declination.
To measure the horizontal component (H),
i.e., variation in the geomagnetic north-south direction,
the magnet is rotated 90 degrees with torsional force of the string.
Then the magnet points in the (geomagnetic) east-west direction
and it is most sensitive to field variation in the geomagnetic
north-south direction.
The vertical component (Z) is
measured by keeping the magnet in the horizontal plane as seen
in the figure.
By adjusting the relative location and direction of
the light source, variometer, and the drum,
three light rays are focused on the drum and the magnetic variation of
the three components is recorded as a magnetogram.
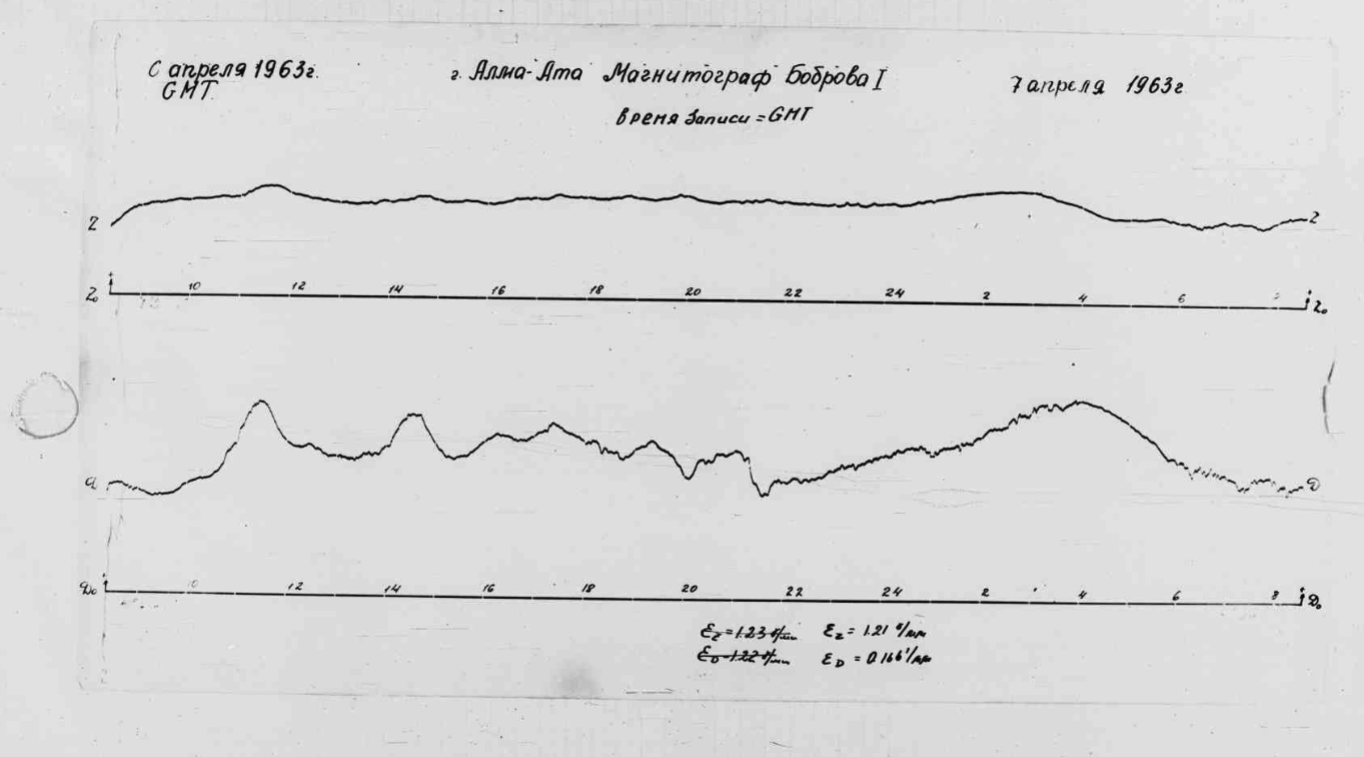
For normal-run magnetograms, the drum rotates once a day.
For rapid-run magnetograms,
the drum rotates many times a day, and the drum shifts slowly in the
direction of the rotation axis, drawing many lines on a magnetogram.
The time mark is recorded by shutting the rays or adding another ray.
The sensitivity depends on the magnetic moment
of the small magnet, torsional elasticity of the string, and
the distance between the mirror and the drum.
The sensitivities per unit length (normally nT/mm on the record)
are found at the beginning of each month.
For Russian magnetograms, they are usually written
on the magnetogram of the first day of the month.
For most other magnetograms, they are normally given on
a separate sheet.
The system is very simple and hence stable in general.
However, new photographic paper has to be set every day.
During severe geomagnetic storms, the three traces sometimes cross each
other. We also have to be careful about distortion caused by
the microfilm camera, because the records kept at WDCs are on microfilm.
Tellurigram and Earth Current
Tellurigrams are analog recordings of Earth currents, which are electric currents flowing in the Earth.
Earth current is measured as the potential difference between two electrodes buried in the Earth,
and thus the unit is electric field. The components are usually eastward and northward.
Natural Earth current of shorter periods is induced by geomagnetic field variations,
and therefore is useful in estimating the conductivity distribution in the Earth
when combined with geomagnetic data. It can also be used as a substitute for
geomagnetic field variation data.
Similar to magnetograms, tellurigrams are classified into "Normal run Tellurigrams"
and "Rapid run Tellurigrams", depending on their recording speed.
The recording principles and techniques are analogous to those used for magnetograms,
but instead of measuring magnetic field variations, they record variations in
the Earth's electric field.
Handmade Torsion-Type Magnetometer with Soda bottle
It is possible to create a simple torsion-type magnetometer, known as a "Soda bottle magnetometer," which is used as an educational tool. At our center, we have improved the Soda bottle magnetometer by combining image recording with a webcam and automatic spot position estimation using computer programs to measure extremely small geomagnetic variations. We conduct classes where students actually measure geomagnetic variations using this system. For more details, please refer to the following center newsletter and lecture materials:
WDC Newsletter 2024 Issue 2, Section 4
Lecture Materials (DOI: 10.14989/kds598559)